Data visualisation from market research
CLIENT
Synthesio
SECTOR
Technology
REGION
France
YEAR
2018
EXPERTISE
Digital Marketing
OUR ROLE
Strategy
Content Marketing
Context
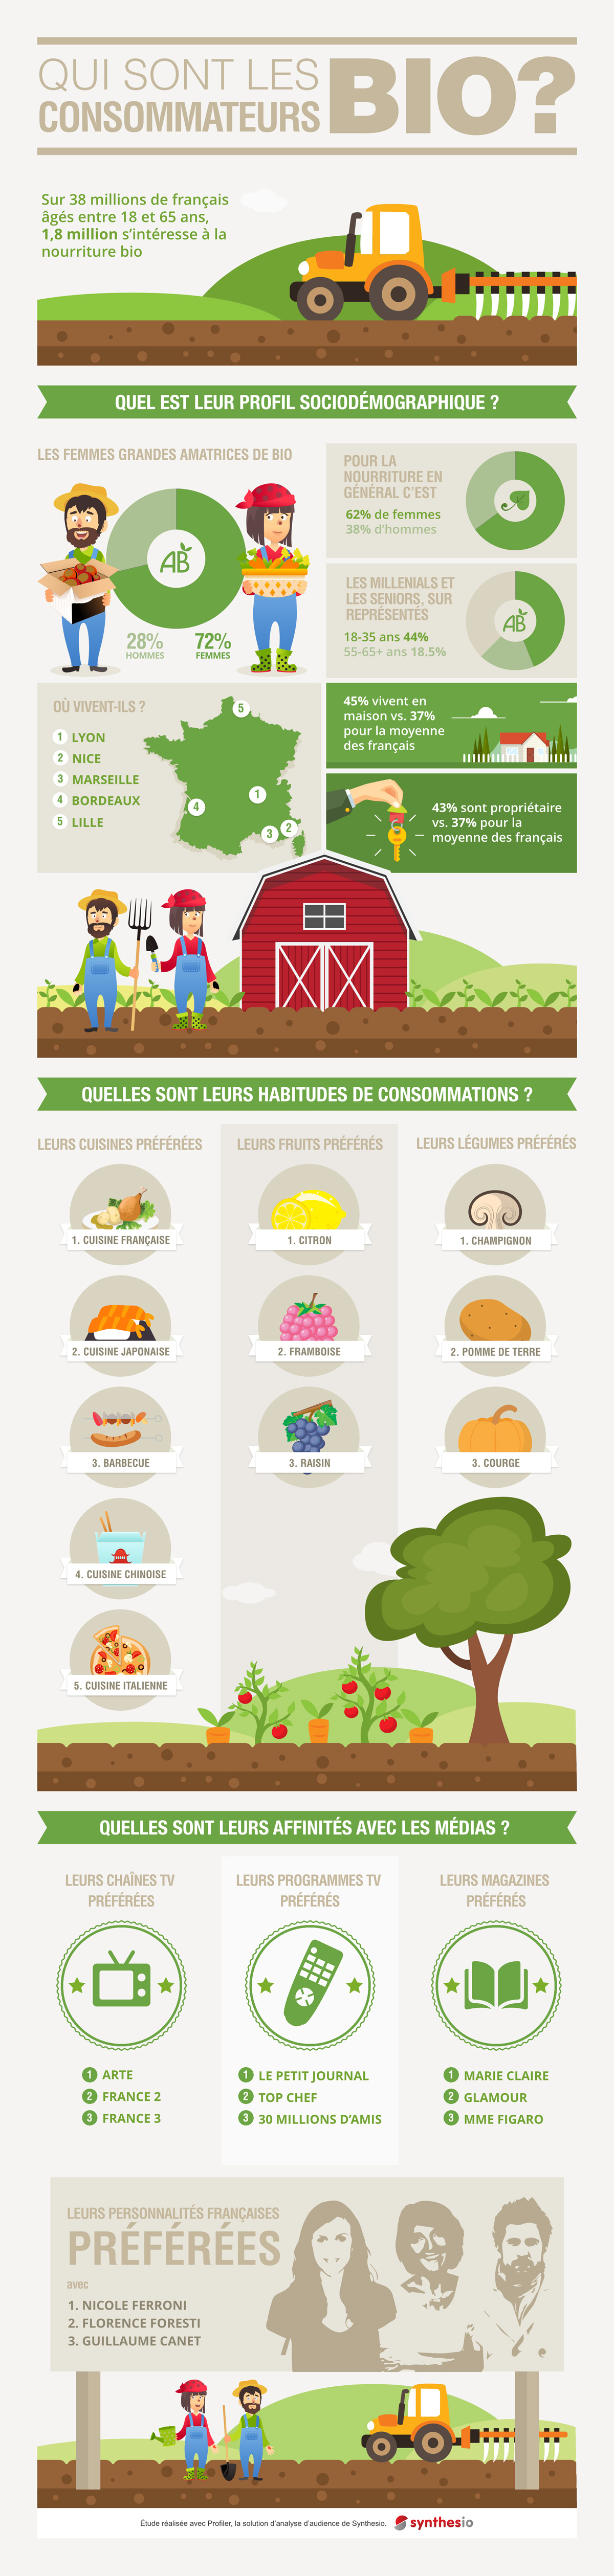
Synthesio’s technology employs market research frameworks to help their clients to rationalize consumer motivation. Make faster, people-centered decisions they can trust. The company was looking to partner with a creative agency with the ability to present data in a graphical format to help people understand its significance.
Approach
It's important to keep in mind that the goal of an infographic is to make complex data easy to understand and to quickly convey key findings or insights.
Therefore, we first thoroughly analised the data to draw the key findings that we wanted to communicate.
Then, we begun to think about the visual design. This included defining the layout, color scheme, typography, and any graphics or charts that would be used to represent the findings.