
Hollow Numbers
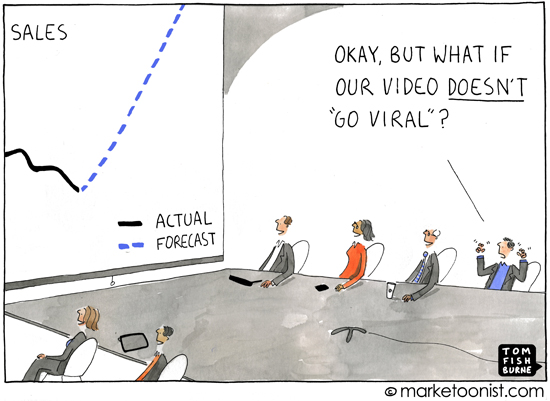
Vanity metrics create an illusion of good results. Whilst they’re usually quite impressive numbers, they don’t provide valuable information that can be acted upon, and can sit outside an organisation’s control. Thus, the makings of a vanity metric lie in its substance or lack thereof.
They’re by no means a new problem either. The author of The Lean Startup, Eric Ries, first wrote about vanity metrics in 2009. Yet despite this, vanity metrics still appear to be a systemic problem, not only in marketing where the term first gained momentum but also in other disciplines like web and digital product design.
There are a few factors behind this issue. Firstly, the standout metrics for popular touchpoints are intrinsically vain. Think social media “likes”, app downloads, and website visits. Especially with social media platforms and search engines, these metrics made sense in the early years before the platforms were monetised.
Secondly, marketers and designers are often under pressure from their executives to show immediate results. This is in opposition to the nature of marketing and design work, which are iterative and generally improve over time. In response to this pressure, marketers and designers turn to vanity metrics in their reporting because they’re easy to obtain and allude to some semblance of success.
Third, the default configuration of most softwares designed to track and analyse metrics does little in terms of providing strategic insight without the touch of a knowledgeable user. Why? Because the very channels these softwares track readily offer the aforementioned metrics of “likes”, “visits”, and “clicks”. These metrics create the illusion of success; they make (often unwitting) users feel good. Understandably, most people like the platform that tells them they’re successful.

Slow Poison
The impact of vanity metrics is far-reaching but can be slow to take effect. Their very existence is a systemic issue in the wider digital ecosystem, so you can imagine just how badly vanity metrics can sway a business off-course.
Poor Reporting
Vanity metrics often exist in isolation from their environment. This lack of context then leads to poor reporting. It can be encouraging to see increasing numbers, but they don’t spell out anything about ROI.
Do these numbers correlate to changes in revenue?
Why are these metrics behaving like this?
Without context, the report offers no relevant data that can be used to inform the next steps, which leads us to the next pitfall of vanity metrics…
Misguided Strategic Decisions
Vanity metrics can feed the heuristic that “bigger is better”. Reporting that focuses on the wrong metrics, or metrics without useful context, can lead brands to focus on the wrong channels and creatives as they fall into the trap of simply chasing bigger numbers.
Expecting Repeatable and Unrealistic Outcomes
This strategy built on shoddy infrastructure is not likely to be robust, reliable, or repeatable. After all, the underlying assumption behind it is weak or simply untrue.
Moreover, vanity metrics can easily be swayed by influences outside of an organisation’s control. For example, YouTube views on a brand’s most recent video can spike (because the algorithm decided to pick it up), and then plummet back down for the following video.
If this brand were simply tracking YouTube views, they might change their content strategy to recreate this virality because of the assumption that more views mean more money. They would be attempting to recreate a random event for the sake of a misguided assumption.
Furthermore, a deeper analysis of their data would reveal that their earlier videos (with fewer views) converted more than their viral hit because their previous content was actually more relevant for viewers with purchasing intent.
First-Hand Experience
Here at Pixel Tie, we’ve had our close encounter with vanity metrics, and understand how deceptive they can be. After six months doing marketing for a client of ours, we had increased their revenue from organic reach by 20% using a content strategy focused on targeted longtail keywords.
Our direct contact, under pressure to improve their KPIs in time for the next quarterly report, asked us to drop the longtail keywords and focus on writing articles to improve the search engine ranking of one specific keyword. From an outsider’s perspective, this change was not for the sake of increasing revenue, but rather to improve the KPIs that determined our direct contact’s performance.
We were able to resolve the situation and continue with our longtail strategy because proven revenue is more important than the performance of one department’s KPIs. In this case, our direct contact’s KPIs were metrics with no correlation to the increase in revenue. Broadly speaking, this is particularly true when there is a trackable conversion rate that factually generates revenue.
We’re lucky to have avoided this situation, but it illustrates how easily vanity metrics can obscure business goals. Furthermore, we would not like to imagine how one dysfunctional cog could impact the rest of the business, especially when our direct contact’s previous activities were bringing such an impressive increase in revenue.
Operationalising Vanity Metrics
A vanity metric for one business may be a critical KPI for another. This is why turning vanity metrics into useful information is a matter of skill and expertise, not just blindly following “best practice”. The following methods demonstrate how successfully operationalising vanity metrics depends on a holistic understanding of a business and its consumers’ behaviour.
Measure Within a Time Frame
Measuring any given data point within a predetermined time frame is one of the most straightforward ways to provide context to a metric. In doing so, changes in a metric can be correlated with changes to the marketing campaign or product design.
However, it’s important not to fall into the trap of tracking the cumulative number of so-and-so metrics over time because this number will always increase. It’s difficult to identify the relationship between any given variable and a cumulative metric.
Short time frames are useful for crisis control, where quick action is required. On the other hand, time frames that are too short will yield graphs that look random and erratic. These are difficult to connect with any deliberate changes made by the business and can lead to false alarms.

Long time frames lead to a stable and less erratic rate of change over time. Whereas longer time frames provide more reliable data, the waiting time is not ideal and can lead businesses to act too slowly. The Nielsen Norman Group recommends balancing the drawbacks of long and short time frames by using the shortest time frame that yields a somewhat stable rate.
Use Ratios To Provide Context
Another way to contextualise a vanity metric is to use it with another relevant metric. This way, the correlation between two metrics can be used to obtain more nuanced information.
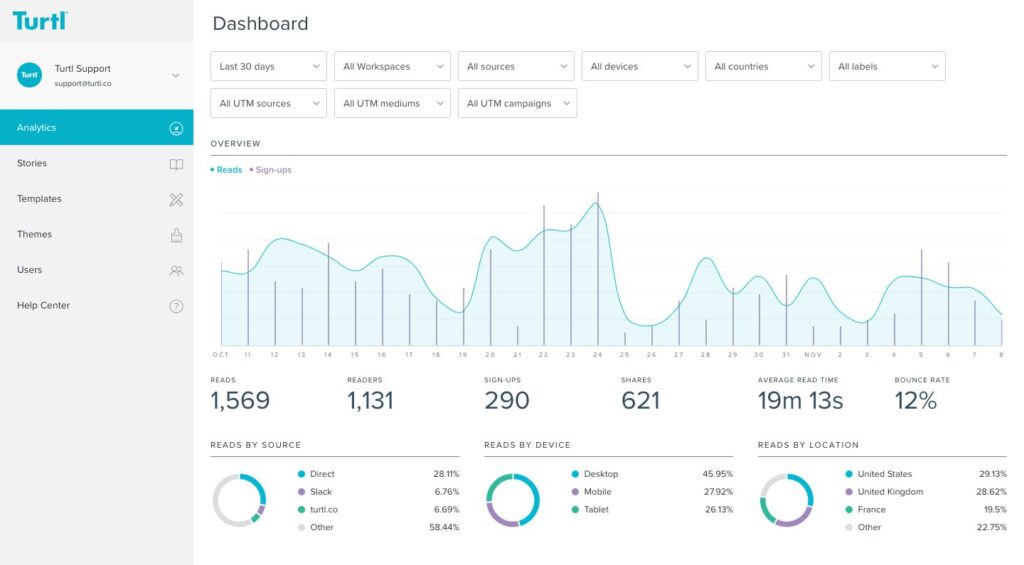
Bounce rate (the total number of single-page sessions divided by the total number of sessions sitewide) indicates how well the website is holding users’ attention. Whereas total views simply indicate the total number of people who saw a site, with no indication if they engaged with it at all.
The click-through rate on emails (total number of clicks divided by the total number of impressions) is a more reasonable measure of the success of an email campaign, in comparison to the open rate (total number of unique opens divided by the total number of recipients). Like webpage views, the open rate doesn’t provide any information about whether or not a user engaged with the content.
Similarly, active new users are a better gauge of how many people are using a digital product than the total number of new users. Even though people have signed up or downloaded a digital product, many times demos and new apps lay forgotten and unseen. Or new users interact with the app but don’t complete any actions that generate revenue for the business.
Per-User and Per-Visit Tracking
As demonstrated in the previous section, per-user tracking is useful for gleaning the proportion of users who complete a certain action (usually a conversion or revenue-generating action for the business).
Segmenting users into cohorts (based on the time they signed up or other defining characteristics) can provide further insight as to how many users are converting. For example, a cohort-based on new users who came from customer referral codes might convert much quicker than the cohort who came from social media.
On the other hand, per-visit or per-session tracking can be useful for tracking user events that occur several times in one session. Returning to the example of total webpage views, tracking the number of times a page is viewed per session can help pinpoint useful or problematic webpages.
Current Developments
Digital Marketing and Social Media
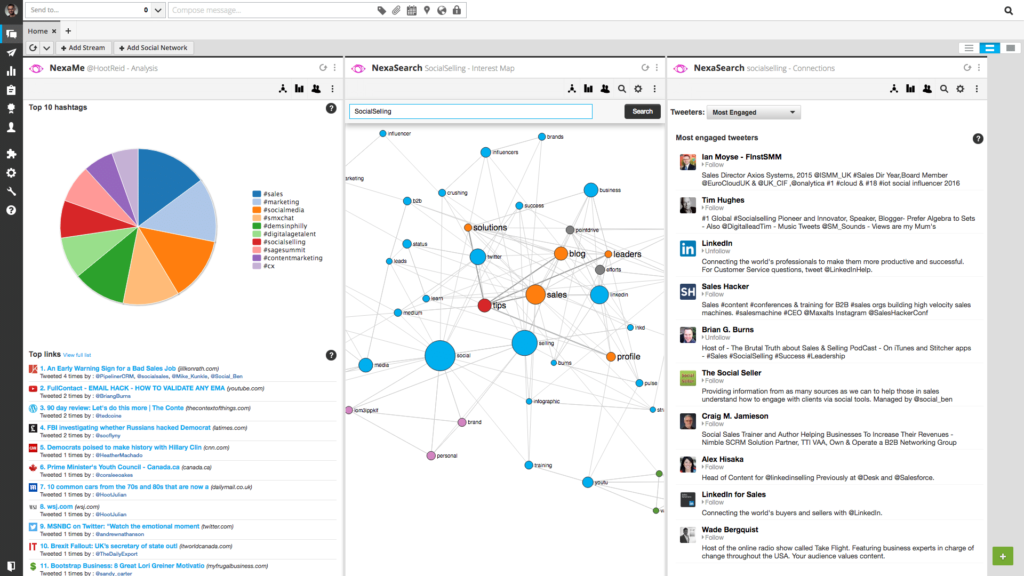
According to research by Hootsuite, marketers at top companies are becoming increasingly comfortable with quantifying the ROI of digital marketing on social media platforms, demonstrating how operationalised vanity metrics can provide business value.
Before COVID-19, the majority of marketing leaders that Hootsuite interviewed were not confident attributing the impact of social media investment on their business goals. As the pandemic forced businesses to rely on digital channels, along with the improvement of attribution models (see below) and the social media platforms themselves, marketers have become confident in the measuring ROI of social media marketing by considering the bigger picture.
These marketers are directing their social media efforts to their upper funnel, thereby focusing on brand awareness, recall, and attracting new customers. When it circles back to business outcomes, this is markedly different from tracking impressions, likes, and new followers.
Social media is also being used increasingly for social listening, especially with the development of social listening tools that aggregate all of the activity happening around a brand. Whilst it’s unlikely to replace dedicated user research, social listening is shaping up to be an incredibly useful tool to obtain immediate feedback and augment consumer insights.
Digital Product Design
Mindshare as a Metric
As mentioned in the section above, marketing technology products are developing complex social listening algorithms that track online activity and brand sentiment. Mindshare, for example, refers to consumer awareness and perception of a brand in relation to its broader digital environment.
Unlike metrics like market share which are more straightforward to calculate, mindshare is significantly more challenging to quantify. However, despite the difficulty, some marketing experts believe that it’s a better measure of the health of a small company because it demonstrates that consumers have a good impression of the brand.
Digital products that calculate and factor mindshare into their attribution models have yet to reach fruition in the mass market, but signals of this development do exist. For example, “mainstream” social media management platforms offer social listening tools to track sentiment, this content creation and performance software includes mindshare in their algorithms, and this social data procurement platform displays mindshare as a KPI for overall performance.
UX Maturity

The Nielsen Norman Group’s UX Maturity model refers to an organisation’s ability to deliver user-centred design. It was first developed in 2006 and was updated in 2021 to account for the changing landscape. The six (previously eight) stages of UX maturity are meant to help businesses understand how their UX strategy, culture, process, and outcomes can be improved.
Unsurprisingly, vanity metrics are present, in some shape or form, from stages two through four. For example, stage two organisations have limited and erratic UX efforts and are often held back by UX efforts that were based on vanity metrics.
Due to a lack of knowledge, vanity metrics can lead these organisations to feel like they’re obtaining user data, which in reality has no practical (or constructive) use in future UX work. Stage three and four organisations face similar problems, like misused data, and lack of alignment with business goals.
The ROI of Design

Recent research by McKinsey shows that fewer than half of design leaders feel their CEO fully understands their role. Although companies excelling in design grow their revenue almost twice as much as their industry peers, 90% of companies aren’t achieving the full potential of design.
This is despite the fact that the majority of McKinsey’s sample had added senior design roles to their organisational structure in the past five years. Fittingly, only one in six of the interviewed design leaders believe that they’re positioned to deliver their full potential value to their company.
Whilst McKinsey provides guidelines about how to harness design, their research indicates that the trickle-down effect of this knowledge on smaller organisations has flown under the radar. Considering the pandemic and other recent developments, making big changes to integrate design is understandably not that big of a priority yet.
Nevertheless, there has been an increase in online literature about communicating the ROI of design to executives, particularly digital product design. According to Google Trends, worldwide interest for “design roi” peaks almost every six months. Tutorials on how to numerically calculate ROI, breaking down the different kinds of value, and packaging this information for executives, have become seasonal content in the niche.
So what?
What does all of this mean for your business? Here are a few key takeaways to help you avoid vanity metrics, or even better, harness vanity metrics to drive growth.
Operationalising vanity metrics requires a 360-degree understanding of your business. Working with the right team is key for successfully utilising vanity metrics in your reporting. Your team will have to go beyond the surface level, understand what makes “best practices” work, and know how to tailor a solution for your business. You’ll want to choose talent that views their success as synonymous with the success of your business, not just the performance of their KPIs.
Look at the bigger picture with more holistic attribution models. Attribution models were a historically fiddly affair, especially when it comes to social media marketing. Nevertheless, marketing technology softwares are catching up to businesses’ needs with more intelligent attribution models. Keep this knowledge in your back pocket, depending on how fast the technology for these attribution models move, you might be making the switch to a new attribution model in the next three to five years.
Don’t underestimate the potential of your designers. Designers aren’t the type to twiddle their thumbs. Organisations with design integrated from the top-down are better positioned to increase revenue and shareholder return than their competitors. Your designers can do much more than make your products look pretty. Give them a chance and they can imbue user-centricity in the entire customer experience. Just bear in mind that quantitatively estimating ROI is not the most straightforward calculation.
Marketing isn’t just marketing and design isn’t just design. Here at Pixel Tie, we have an innate understanding of the synergy between the different aspects of a business. If you’d like to benefit from our expertise, please feel free to reach us here.
Further Reading
Why vanity metrics are dangerous – Startup Lessons Learned
Vanity Metrics: Add Context to Add Meaning – Nielsen Norman Group
Social Trends 2022 – Hootsuite
Are you asking enough from your design leaders? – McKinsey & Company
What’s the ROI of Design? – Matthew Godfrey on Medium
The True ROI of UX: Convincing the Executive Suite – Toptal
Calculating ROI for Design Projects in 4 Steps – Nielsen Norman Group


1 Comment
Pingback: How to Spot an Effective Design Team – Pixel Tie | Blog